M_004 — CASE STUDY
MERIDIAN ATLAS
Spatial data platform for climate research
OVERVIEW
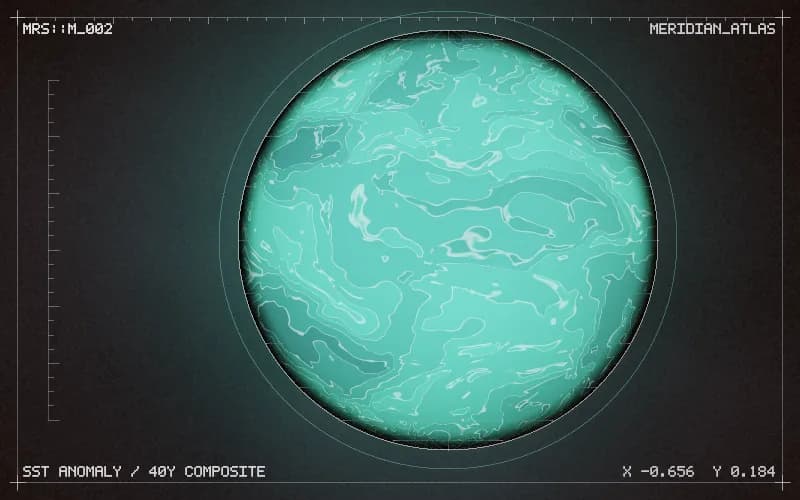
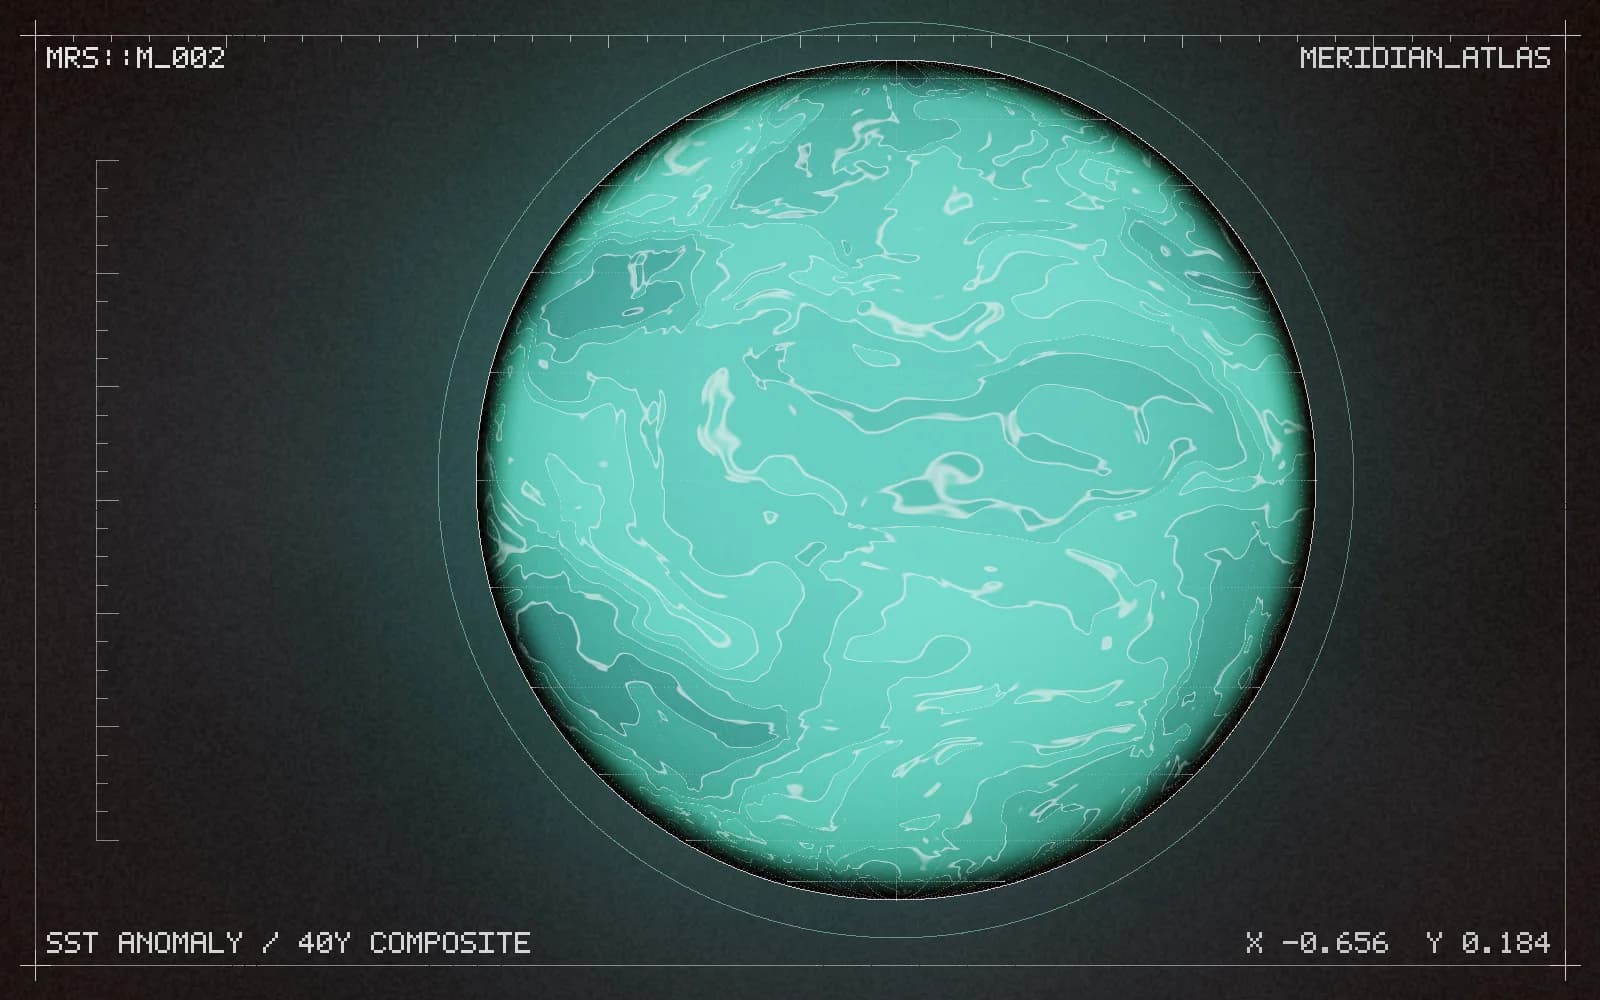
Meridian holds 40 years of satellite observation across 14 variables. The existing tool served static images. We built a live globe that streams tiled scientific data on demand, letting researchers scrub a variable across time and compare regions side by side without leaving the browser.
- CLIENT
- Meridian Earth
- YEAR
- 2025
- ROLE
- Product DesignCreative DevelopmentData Visualisation
- TECH STACK
- ReactThree.jsWebGL2Web WorkersZarrRust/WASM
MEASURED IMPACT
Time span
40yr
Variables
14
Tiles
2.1M
First paint
0.9s
SYSTEM ARCHITECTURE & DESIGN
Streaming
Data is pre-tiled into a quadtree of float textures with three levels of detail. Tiles are requested on camera settle, decoded in a worker pool, and uploaded during idle frames — so a viewport change never blocks the render loop.
Honest colour
Scientific colour maps are perceptually uniform for a reason. We implemented the full set as 1D lookup textures, with a diverging option anchored at the variable-specific zero, and added a colour-blind-safe default that the team could not previously offer.
Two globes, one camera
Comparison mode renders two globes in a split viewport sharing one camera controller. It is a single scene with a scissor test rather than two canvases, which keeps memory flat and guarantees the two views can never desynchronise.
VISUAL GALLERY